heatmap
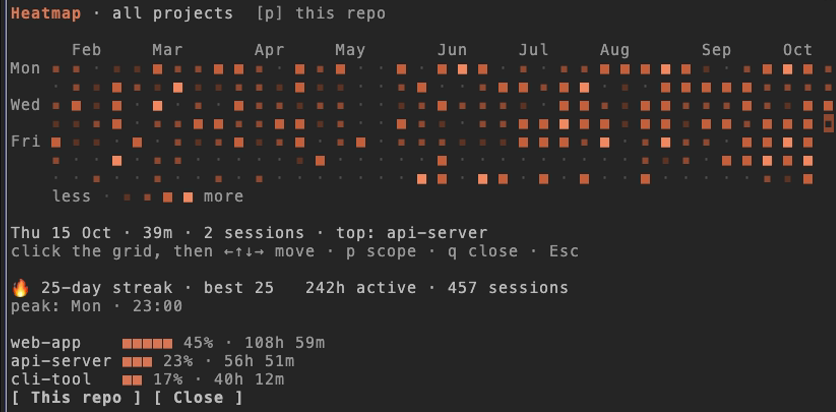
A GitHub-style grid of your Claude Code time, one square per day.
Install
claude plugin marketplace add hamzafer/claude-code-mods
claude plugin install heatmap@claude-code-modsRestart Claude Code after installing. To try it without installing, clone the repo and run claude --plugin-dir mods/heatmap.
How to use
/heatmap- Opens the grid
p- Switches between all projects and this repo
← ↑ ↓ →- Click the grid first, then move a day cursor that shows that day's time, sessions and top project
q- Closes it
How it behaves
- Each square is one day of active minutes: the time between messages, where a pause over 5 minutes adds nothing.
- Shows as many weeks as fit the pane, up to a year. Under the grid: your current and best streak, active hours, your busiest weekday and hour, and your top 3 projects.
- A toast when a streak reaches 7, 30 or 100 days.
- Claude Code deletes session logs after 30 days by default. heatmap keeps one small line per day per project, so the grid keeps growing after the logs are gone. Everything stays on your computer.